Cherryvale, KS Profile
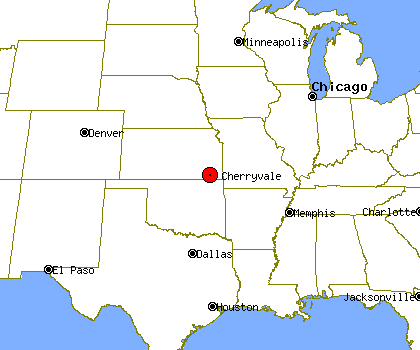
Cherryvale, KS, population 2,244, is located
in Kansas's Montgomery county,
about 81.0 miles from Tulsa and 102.2 miles from Wichita.
Through the 90's Cherryvale's population has declined by about 3%.
It is estimated that in the first 5 years of the past decade the population of Cherryvale has declined by about 5%. Since 2005 Cherryvale's population has stayed about the same.
Cherryvale's property crime levels tend to be
Kansas's average level.
Population Statistics
Gender
| Population by Gender |
|---|
| Males | 48% |
| Females | 52% |
Race
| Population by Race |
|---|
| White | 94% |
| African American | 0% |
| Native American | 2% |
| Asian | 0% |
| Hawaiian | 0% |
| Other/Mixed | 4% |
Age
| Median Age |
|---|
| Population | 9.99 |
| Males | 9.99 |
| Females | 9.99 |
| Males by Age | Females by Age |
|---|
| Under 20 | 9.99% | | Under 20: | 9.99% |
| 20 to 40 | 9.99% | | 20 to 40: | 9.99% |
| 40 to 60 | 9.99% | | 40 to 60: | 9.99% |
| Over 60 | 8.00% | | Over 60: | 9.99% |
Size
| Population by Year | Change Rate |
|---|
| 2000 | 2,393 | N/A |
| 2001 | 2,363 | -1.25% |
| 2002 | 2,316 | -1.99% |
| 2003 | 2,286 | -1.30% |
| 2004 | 2,272 | -0.61% |
| 2005 | 2,248 | -1.06% |
| 2006 | 2,249 | 0.04% |
| 2007 | 2,262 | 0.58% |
| 2008 | 2,248 | -0.62% |
| 2009 | 2,244 | -0.18% |
Economics
| Household Income |
|---|
| Median | $27,917 |
Law Enforcement Statistics
Violent Crime Reports
| Rate Per 100K People |
|---|
| 2001 | N/A |
| 2002 | 207 |
| 2003 | N/A |
| 2004 | N/A |
| 2005 | N/A |
| 2006 | N/A |
| 2007 | N/A |
| 2008 | 133 |
| 2009 | N/A |
| 2010 | N/A |
| Vs. State Violent Crime Rate |
|---|
| Year |
Murder, Man-Slaughter |
Forcible Rape |
Robbery |
Aggravated Assault |
| 2001 |
- | - | - | - |
| 2002 |
0 | 0 | 1 | 4 |
| 2003 |
- | - | - | - |
| 2004 |
- | - | - | - |
| 2005 |
- | - | - | - |
| 2006 |
- | - | - | - |
| 2007 |
- | - | - | - |
| 2008 |
0 | 0 | 0 | 3 |
| 2009 |
- | - | - | - |
| 2010 |
- | - | - | - |
Property Crime Reports
| Rate Per 100K People |
|---|
| 2001 | N/A |
| 2002 | 3,485 |
| 2003 | N/A |
| 2004 | N/A |
| 2005 | N/A |
| 2006 | N/A |
| 2007 | N/A |
| 2008 | 2,669 |
| 2009 | N/A |
| 2010 | N/A |
| Vs. State Property Crime Rate |
|---|
| Year |
Burglary |
Larceny, Theft |
Motor Vehicle Theft |
| 2001 |
- |
- |
- |
| 2002 |
23 |
59 |
2 |
| 2003 |
- |
- |
- |
| 2004 |
- |
- |
- |
| 2005 |
- |
- |
- |
| 2006 |
- |
- |
- |
| 2007 |
- |
- |
- |
| 2008 |
15 |
39 |
6 |
| 2009 |
- |
- |
- |
| 2010 |
- |
- |
- |
Location
| Elevation | 850 feet above sea level |
| Land Area | 1.5 Square Miles |