Iowa, LA Profile
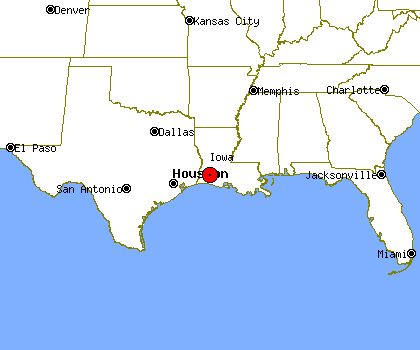
Iowa, LA, population 2,627, is located
in Louisiana's Calcasieu county,
about 59.4 miles from Lafayette and 65.9 miles from Beaumont.
Through the 90's Iowa's population has grown by about 3%.
It is estimated that in the first 5 years of the past decade the population of Iowa has declined by about 3%. Since 2005 Iowa's population has grown by about 2%.
Iowa's property crime levels tend to be higher than Louisiana's average level.
The same data shows violent crime levels in Iowa tend to be higher than Louisiana's average level.
Population Statistics
Gender
| Population by Gender |
|---|
| Males | 48% |
| Females | 52% |
Race
| Population by Race |
|---|
| White | 79% |
| African American | 19% |
| Native American | 0% |
| Asian | 0% |
| Hawaiian | 0% |
| Other/Mixed | 2% |
Age
| Median Age |
|---|
| Population | 9.99 |
| Males | 9.99 |
| Females | 9.99 |
| Males by Age | Females by Age |
|---|
| Under 20 | 9.99% | | Under 20: | 9.99% |
| 20 to 40 | 9.99% | | 20 to 40: | 9.99% |
| 40 to 60 | 9.99% | | 40 to 60: | 9.99% |
| Over 60 | 7.00% | | Over 60: | 8.00% |
Size
| Population by Year | Change Rate |
|---|
| 2000 | 2,663 | N/A |
| 2001 | 2,642 | -0.79% |
| 2002 | 2,626 | -0.61% |
| 2003 | 2,633 | 0.27% |
| 2004 | 2,602 | -1.18% |
| 2005 | 2,580 | -0.85% |
| 2006 | 2,558 | -0.85% |
| 2007 | 2,605 | 1.84% |
| 2008 | 2,623 | 0.69% |
| 2009 | 2,627 | 0.15% |
Economics
| Household Income |
|---|
| Median | $31,581 |
Law Enforcement Statistics
Violent Crime Reports
| Rate Per 100K People |
|---|
| 2001 | 1,240 |
| 2002 | 1,310 |
| 2003 | 455 |
| 2004 | 568 |
| 2005 | 611 |
| 2006 | 733 |
| 2007 | 585 |
| 2008 | 385 |
| 2009 | 420 |
| 2010 | 304 |
| Vs. State Violent Crime Rate |
|---|
| Year |
Murder, Man-Slaughter |
Forcible Rape |
Robbery |
Aggravated Assault |
| 2001 |
0 | 0 | 1 | 32 |
| 2002 |
0 | 1 | 1 | 33 |
| 2003 |
0 | 0 | 0 | 12 |
| 2004 |
0 | 0 | 0 | 15 |
| 2005 |
0 | 0 | 3 | 13 |
| 2006 |
0 | 1 | 2 | 15 |
| 2007 |
0 | 0 | 1 | 14 |
| 2008 |
0 | 0 | 3 | 7 |
| 2009 |
0 | 0 | 1 | 10 |
| 2010 |
0 | 0 | 2 | 6 |
Property Crime Reports
| Rate Per 100K People |
|---|
| 2001 | 5,261 |
| 2002 | 5,766 |
| 2003 | 6,593 |
| 2004 | 4,964 |
| 2005 | 5,420 |
| 2006 | 5,008 |
| 2007 | 4,834 |
| 2008 | 4,579 |
| 2009 | 4,472 |
| 2010 | 4,214 |
| Vs. State Property Crime Rate |
|---|
| Year |
Burglary |
Larceny, Theft |
Motor Vehicle Theft |
| 2001 |
16 |
122 |
2 |
| 2002 |
17 |
133 |
4 |
| 2003 |
24 |
144 |
6 |
| 2004 |
28 |
94 |
9 |
| 2005 |
36 |
96 |
10 |
| 2006 |
19 |
97 |
7 |
| 2007 |
28 |
88 |
8 |
| 2008 |
25 |
86 |
8 |
| 2009 |
29 |
84 |
4 |
| 2010 |
33 |
77 |
1 |
Location
| Elevation | 25 feet above sea level |
| Land Area | 2.8 Square Miles |