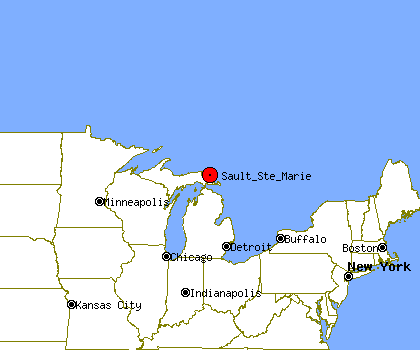
Sault Ste. Marie, MI Profile
Sault Ste. Marie, MI, population 14,003, is located
in Michigan's Chippewa county,
about 224.5 miles from Green Bay and 243.0 miles from Flint.
Through the 90's Sault Ste. Marie's population has grown by about 13%.
It is estimated that in the first 5 years of the past decade the population of Sault Ste. Marie has declined by about 13%. Since 2005 Sault Ste. Marie's population has declined by about 1%.
Sault Ste. Marie's property crime levels tend to be about the same as
Michigan's average level.
The same data shows violent crime levels in Sault Ste. Marie tend to be much lower than Michigan's average level.
Population Statistics
Gender
| Population by Gender |
|---|
| Males | 55% |
| Females | 45% |
Race
| Population by Race |
|---|
| White | 74% |
| African American | 7% |
| Native American | 14% |
| Asian | 1% |
| Hawaiian | 0% |
| Other/Mixed | 4% |
Age
| Median Age |
|---|
| Population | 9.99 |
| Males | 9.99 |
| Females | 9.99 |
| Males by Age | Females by Age |
|---|
| Under 20 | 9.99% | | Under 20: | 9.99% |
| 20 to 40 | 9.99% | | 20 to 40: | 9.99% |
| 40 to 60 | 9.99% | | 40 to 60: | 9.99% |
| Over 60 | 6.00% | | Over 60: | 9.99% |
Size
| Population by Year | Change Rate |
|---|
| 2000 | 14,324 | N/A |
| 2001 | 14,199 | -0.87% |
| 2002 | 14,105 | -0.66% |
| 2003 | 14,042 | -0.45% |
| 2004 | 14,057 | 0.11% |
| 2005 | 14,181 | 0.88% |
| 2006 | 14,081 | -0.71% |
| 2007 | 14,055 | -0.18% |
| 2008 | 14,021 | -0.24% |
| 2009 | 14,003 | -0.13% |
Economics
| Household Income |
|---|
| Median | $29,652 |
Law Enforcement Statistics
Violent Crime Reports
| Rate Per 100K People |
|---|
| 2001 | 271 |
| 2002 | N/A |
| 2003 | 175 |
| 2004 | 134 |
| 2005 | 240 |
| 2006 | 280 |
| 2007 | 294 |
| 2008 | 272 |
| 2009 | 334 |
| 2010 | 599 |
| Vs. State Violent Crime Rate |
|---|
| Year |
Murder, Man-Slaughter |
Forcible Rape |
Robbery |
Aggravated Assault |
| 2001 |
1 | 16 | 2 | 26 |
| 2002 |
- | - | - | - |
| 2003 |
0 | 3 | 4 | 18 |
| 2004 |
0 | 6 | 2 | 11 |
| 2005 |
0 | 4 | 4 | 26 |
| 2006 |
0 | 11 | 3 | 26 |
| 2007 |
0 | 11 | 4 | 27 |
| 2008 |
0 | 5 | 2 | 31 |
| 2009 |
0 | 19 | 3 | 25 |
| 2010 |
0 | 10 | 8 | 65 |
Property Crime Reports
| Rate Per 100K People |
|---|
| 2001 | 3,055 |
| 2002 | N/A |
| 2003 | 3,027 |
| 2004 | 3,057 |
| 2005 | 3,804 |
| 2006 | 4,033 |
| 2007 | 4,503 |
| 2008 | 3,808 |
| 2009 | 3,982 |
| 2010 | 4,758 |
| Vs. State Property Crime Rate |
|---|
| Year |
Burglary |
Larceny, Theft |
Motor Vehicle Theft |
| 2001 |
57 |
427 |
24 |
| 2002 |
- |
- |
- |
| 2003 |
41 |
354 |
38 |
| 2004 |
53 |
350 |
32 |
| 2005 |
77 |
432 |
30 |
| 2006 |
93 |
454 |
29 |
| 2007 |
120 |
498 |
25 |
| 2008 |
73 |
436 |
23 |
| 2009 |
69 |
471 |
20 |
| 2010 |
113 |
514 |
32 |
Location
| Elevation | 613 feet above sea level |
| Land Area | 14.8 Square Miles |
| Water Area | 5.4 Square Miles |


