Kimball, SD Profile
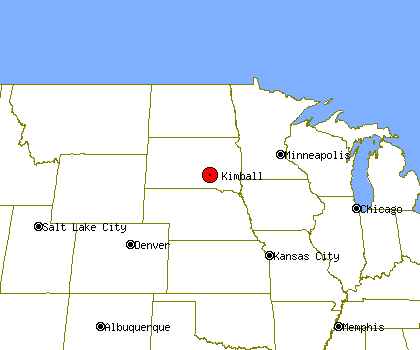
Kimball, SD, population 700, is located
in South Dakota's Brule county,
about 113.8 miles from Sioux Falls and 230.9 miles from Omaha.
It is estimated that in the first 5 years of the past decade the population of Kimball has declined by about 7%. Since 2005 Kimball's population has grown by about 3%.
Population Statistics
Gender
| Population by Gender |
|---|
| Males | 47% |
| Females | 53% |
Race
| Population by Race |
|---|
| White | 99% |
| African American | 0% |
| Native American | 1% |
| Asian | 0% |
| Hawaiian | 0% |
| Other/Mixed | 0% |
Age
| Median Age |
|---|
| Population | 9.99 |
| Males | 9.99 |
| Females | 9.99 |
| Males by Age | Females by Age |
|---|
| Under 20 | 9.99% | | Under 20: | 9.99% |
| 20 to 40 | 9.99% | | 20 to 40: | 9.99% |
| 40 to 60 | 9.99% | | 40 to 60: | 9.99% |
| Over 60 | 9.99% | | Over 60: | 9.99% |
Size
| Population by Year | Change Rate |
|---|
| 2000 | 745 | N/A |
| 2001 | 719 | -3.49% |
| 2002 | 702 | -2.36% |
| 2003 | 698 | -0.57% |
| 2004 | 691 | -1.00% |
| 2005 | 682 | -1.30% |
| 2006 | 675 | -1.03% |
| 2007 | 685 | 1.48% |
| 2008 | 692 | 1.02% |
| 2009 | 700 | 1.16% |
Economics
| Household Income |
|---|
| Median | $32,167 |
Law Enforcement Statistics
Violent Crime Reports
| Rate Per 100K People |
|---|
| 2001 | N/A |
| 2002 | N/A |
| 2003 | N/A |
| 2004 | N/A |
| 2005 | N/A |
| 2006 | 0 |
| 2007 | 0 |
| 2008 | 0 |
| 2009 | 0 |
| 2010 | 0 |
| Vs. State Violent Crime Rate |
|---|
| Year |
Murder, Man-Slaughter |
Forcible Rape |
Robbery |
Aggravated Assault |
| 2001 |
- | - | - | - |
| 2002 |
- | - | - | - |
| 2003 |
- | - | - | - |
| 2004 |
- | - | - | - |
| 2005 |
- | - | - | - |
| 2006 |
0 | 0 | 0 | 0 |
| 2007 |
0 | 0 | 0 | 0 |
| 2008 |
0 | 0 | 0 | 0 |
| 2009 |
0 | 0 | 0 | 0 |
| 2010 |
0 | 0 | 0 | 0 |
Property Crime Reports
| Rate Per 100K People |
|---|
| 2001 | N/A |
| 2002 | N/A |
| 2003 | N/A |
| 2004 | N/A |
| 2005 | N/A |
| 2006 | 0 |
| 2007 | 0 |
| 2008 | 0 |
| 2009 | 437 |
| 2010 | 0 |
| Vs. State Property Crime Rate |
|---|
| Year |
Burglary |
Larceny, Theft |
Motor Vehicle Theft |
| 2001 |
- |
- |
- |
| 2002 |
- |
- |
- |
| 2003 |
- |
- |
- |
| 2004 |
- |
- |
- |
| 2005 |
- |
- |
- |
| 2006 |
0 |
0 |
0 |
| 2007 |
0 |
0 |
0 |
| 2008 |
0 |
0 |
0 |
| 2009 |
3 |
0 |
0 |
| 2010 |
0 |
0 |
0 |
Location
| Elevation | 1,788 feet above sea level |
| Land Area | 3.1 Square Miles |