Shoreline, WA Profile
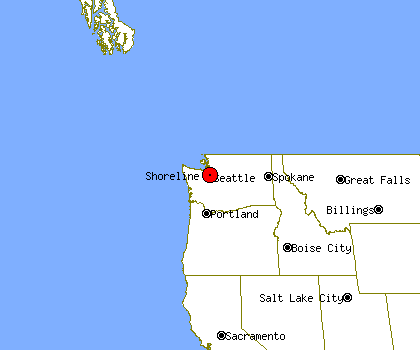
Shoreline, WA, population 52,775, is located
in Washington's King county,
about 10.3 miles from Seattle and 12.0 miles from Bellevue.
It is estimated that in the first 5 years of the past decade the population of Shoreline has declined by about 2%. Since 2005 Shoreline's population has grown by about 1%.
Shoreline's property crime levels tend to be lower than
Washington's average level.
The same data shows violent crime levels in Shoreline tend to be lower than Washington's average level.
Population Statistics
Gender
| Population by Gender |
|---|
| Males | 48% |
| Females | 52% |
Race
| Population by Race |
|---|
| White | 77% |
| African American | 3% |
| Native American | 1% |
| Asian | 13% |
| Hawaiian | 0% |
| Other/Mixed | 6% |
Age
| Median Age |
|---|
| Population | 9.99 |
| Males | 9.99 |
| Females | 9.99 |
| Males by Age | Females by Age |
|---|
| Under 20 | 9.99% | | Under 20: | 9.99% |
| 20 to 40 | 9.99% | | 20 to 40: | 9.99% |
| 40 to 60 | 9.99% | | 40 to 60: | 9.99% |
| Over 60 | 7.00% | | Over 60: | 9.99% |
Size
| Population by Year | Change Rate |
|---|
| 2000 | 53,293 | N/A |
| 2001 | 53,048 | -0.46% |
| 2002 | 52,645 | -0.76% |
| 2003 | 52,146 | -0.95% |
| 2004 | 51,867 | -0.54% |
| 2005 | 52,045 | 0.34% |
| 2006 | 52,228 | 0.35% |
| 2007 | 52,370 | 0.27% |
| 2008 | 52,426 | 0.11% |
| 2009 | 52,775 | 0.67% |
Economics
| Household Income |
|---|
| Median | $51,658 |
Law Enforcement Statistics
Violent Crime Reports
| Rate Per 100K People |
|---|
| 2001 | 202 |
| 2002 | 223 |
| 2003 | 242 |
| 2004 | 285 |
| 2005 | 236 |
| 2006 | 255 |
| 2007 | 232 |
| 2008 | 185 |
| 2009 | 177 |
| 2010 | 205 |
| Vs. State Violent Crime Rate |
|---|
| Year |
Murder, Man-Slaughter |
Forcible Rape |
Robbery |
Aggravated Assault |
| 2001 |
0 | 16 | 46 | 47 |
| 2002 |
1 | 15 | 41 | 65 |
| 2003 |
1 | 15 | 48 | 65 |
| 2004 |
1 | 33 | 54 | 63 |
| 2005 |
0 | 21 | 42 | 61 |
| 2006 |
0 | 21 | 60 | 54 |
| 2007 |
2 | 21 | 53 | 45 |
| 2008 |
0 | 13 | 45 | 39 |
| 2009 |
0 | 13 | 34 | 45 |
| 2010 |
1 | 21 | 43 | 43 |
Property Crime Reports
| Rate Per 100K People |
|---|
| 2001 | 3,334 |
| 2002 | 3,289 |
| 2003 | 4,112 |
| 2004 | 4,225 |
| 2005 | 4,471 |
| 2006 | 3,870 |
| 2007 | 3,217 |
| 2008 | 3,182 |
| 2009 | 3,096 |
| 2010 | 2,673 |
| Vs. State Property Crime Rate |
|---|
| Year |
Burglary |
Larceny, Theft |
Motor Vehicle Theft |
| 2001 |
307 |
1,262 |
227 |
| 2002 |
275 |
1,259 |
262 |
| 2003 |
324 |
1,544 |
325 |
| 2004 |
447 |
1,417 |
375 |
| 2005 |
468 |
1,358 |
528 |
| 2006 |
381 |
1226 |
441 |
| 2007 |
326 |
1152 |
201 |
| 2008 |
362 |
1131 |
180 |
| 2009 |
395 |
1104 |
107 |
| 2010 |
311 |
994 |
100 |
Location


