Casa Grande, AZ Profile
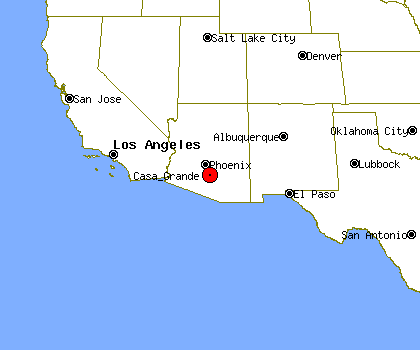
Casa Grande, AZ, population 43,878, is located
in Arizona's Pinal county,
about 29.9 miles from Chandler and 32.8 miles from Gilbert.
Through the 90's Casa Grande's population has grown by about 32%.
It is estimated that in the first 5 years of the past decade the population of Casa Grande has grown by about 30%. Since 2005 Casa Grande's population has grown by about 31%.
Casa Grande's property crime levels tend to be much higher than
Arizona's average level.
The same data shows violent crime levels in Casa Grande tend to be much higher than Arizona's average level.
Population Statistics
Gender
| Population by Gender |
|---|
| Males | 49% |
| Females | 51% |
Race
| Population by Race |
|---|
| White | 65% |
| African American | 4% |
| Native American | 5% |
| Asian | 1% |
| Hawaiian | 0% |
| Other/Mixed | 25% |
Age
| Median Age |
|---|
| Population | 9.99 |
| Males | 9.99 |
| Females | 9.99 |
| Males by Age | Females by Age |
|---|
| Under 20 | 9.99% | | Under 20: | 9.99% |
| 20 to 40 | 9.99% | | 20 to 40: | 9.99% |
| 40 to 60 | 9.99% | | 40 to 60: | 9.99% |
| Over 60 | 8.00% | | Over 60: | 9.99% |
Size
| Population by Year | Change Rate |
|---|
| 2000 | 26,717 | N/A |
| 2001 | 27,835 | 4.18% |
| 2002 | 29,608 | 6.37% |
| 2003 | 30,857 | 4.22% |
| 2004 | 32,323 | 4.75% |
| 2005 | 33,538 | 3.76% |
| 2006 | 35,003 | 4.37% |
| 2007 | 38,891 | 9.99% |
| 2008 | 41,995 | 7.98% |
| 2009 | 43,878 | 4.48% |
Economics
| Household Income |
|---|
| Median | $36,212 |
Law Enforcement Statistics
Violent Crime Reports
| Rate Per 100K People |
|---|
| 2001 | 675 |
| 2002 | 962 |
| 2003 | 957 |
| 2004 | 896 |
| 2005 | 825 |
| 2006 | 727 |
| 2007 | 854 |
| 2008 | 551 |
| 2009 | 587 |
| 2010 | 588 |
| Vs. State Violent Crime Rate |
|---|
| Year |
Murder, Man-Slaughter |
Forcible Rape |
Robbery |
Aggravated Assault |
| 2001 |
2 | 2 | 32 | 140 |
| 2002 |
2 | 0 | 15 | 241 |
| 2003 |
0 | 7 | 42 | 232 |
| 2004 |
0 | 6 | 59 | 209 |
| 2005 |
3 | 4 | 53 | 206 |
| 2006 |
1 | 4 | 49 | 194 |
| 2007 |
2 | 5 | 79 | 221 |
| 2008 |
0 | 4 | 45 | 171 |
| 2009 |
4 | 6 | 60 | 184 |
| 2010 |
1 | 6 | 52 | 191 |
Property Crime Reports
| Rate Per 100K People |
|---|
| 2001 | 8,263 |
| 2002 | 7,139 |
| 2003 | 9,080 |
| 2004 | 11,345 |
| 2005 | 10,346 |
| 2006 | 9,067 |
| 2007 | 8,411 |
| 2008 | 7,403 |
| 2009 | 6,487 |
| 2010 | 6,695 |
| Vs. State Property Crime Rate |
|---|
| Year |
Burglary |
Larceny, Theft |
Motor Vehicle Theft |
| 2001 |
607 |
1,373 |
176 |
| 2002 |
582 |
1,158 |
175 |
| 2003 |
786 |
1,578 |
301 |
| 2004 |
1,163 |
1,851 |
454 |
| 2005 |
1,208 |
1,761 |
368 |
| 2006 |
1042 |
1678 |
373 |
| 2007 |
968 |
1710 |
346 |
| 2008 |
1069 |
1629 |
258 |
| 2009 |
677 |
1901 |
228 |
| 2010 |
599 |
2075 |
173 |
Location
| Elevation | 1,393 feet above sea level |
| Land Area | 21.8 Square Miles |


