San Angelo, TX Profile
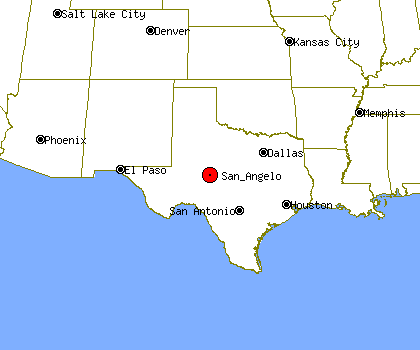
San Angelo, TX, population 92,149, is located
in Texas's Tom Green county,
about 79.7 miles from Abilene and 168.0 miles from Lubbock.
Through the 90's San Angelo's population has grown by about 5%.
It is estimated that in the first 5 years of the past decade the population of San Angelo has stayed about the same. Since 2005 San Angelo's population has grown by about 3%.
San Angelo's property crime levels tend to be higher than Texas's average level.
The same data shows violent crime levels in San Angelo tend to be lower than Texas's average level.
Population Statistics
Gender
| Population by Gender |
|---|
| Males | 48% |
| Females | 52% |
Race
| Population by Race |
|---|
| White | 77% |
| African American | 5% |
| Native American | 1% |
| Asian | 1% |
| Hawaiian | 0% |
| Other/Mixed | 16% |
Age
| Median Age |
|---|
| Population | 9.99 |
| Males | 9.99 |
| Females | 9.99 |
| Males by Age | Females by Age |
|---|
| Under 20 | 9.99% | | Under 20: | 9.99% |
| 20 to 40 | 9.99% | | 20 to 40: | 9.99% |
| 40 to 60 | 9.99% | | 40 to 60: | 9.99% |
| Over 60 | 7.00% | | Over 60: | 9.99% |
Size
| Population by Year | Change Rate |
|---|
| 2000 | 88,424 | N/A |
| 2001 | 88,135 | -0.33% |
| 2002 | 88,293 | 0.18% |
| 2003 | 88,809 | 0.58% |
| 2004 | 88,934 | 0.14% |
| 2005 | 89,100 | 0.19% |
| 2006 | 89,914 | 0.91% |
| 2007 | 90,513 | 0.67% |
| 2008 | 91,316 | 0.89% |
| 2009 | 92,149 | 0.91% |
Economics
| Household Income |
|---|
| Median | $32,232 |
Law Enforcement Statistics
Violent Crime Reports
| Rate Per 100K People |
|---|
| 2001 | 512 |
| 2002 | 424 |
| 2003 | 458 |
| 2004 | 464 |
| 2005 | 416 |
| 2006 | 438 |
| 2007 | 403 |
| 2008 | 407 |
| 2009 | 399 |
| 2010 | 299 |
| Vs. State Violent Crime Rate |
|---|
| Year |
Murder, Man-Slaughter |
Forcible Rape |
Robbery |
Aggravated Assault |
| 2001 |
2 | 67 | 49 | 345 |
| 2002 |
0 | 55 | 50 | 287 |
| 2003 |
1 | 77 | 62 | 267 |
| 2004 |
1 | 81 | 58 | 275 |
| 2005 |
3 | 55 | 40 | 275 |
| 2006 |
3 | 53 | 62 | 278 |
| 2007 |
1 | 46 | 48 | 261 |
| 2008 |
6 | 63 | 66 | 234 |
| 2009 |
8 | 65 | 45 | 250 |
| 2010 |
1 | 48 | 50 | 177 |
Property Crime Reports
| Rate Per 100K People |
|---|
| 2001 | 5,823 |
| 2002 | 5,766 |
| 2003 | 6,719 |
| 2004 | 6,541 |
| 2005 | 5,983 |
| 2006 | 5,035 |
| 2007 | 5,067 |
| 2008 | 4,933 |
| 2009 | 4,603 |
| 2010 | 4,520 |
| Vs. State Property Crime Rate |
|---|
| Year |
Burglary |
Larceny, Theft |
Motor Vehicle Theft |
| 2001 |
1,023 |
4,036 |
208 |
| 2002 |
1,048 |
4,055 |
223 |
| 2003 |
1,264 |
4,464 |
237 |
| 2004 |
1,079 |
4,523 |
246 |
| 2005 |
1,137 |
3,941 |
280 |
| 2006 |
974 |
3359 |
224 |
| 2007 |
932 |
3312 |
229 |
| 2008 |
1046 |
3198 |
232 |
| 2009 |
996 |
3092 |
159 |
| 2010 |
1035 |
2976 |
158 |
Location
| Elevation | 1,848 feet above sea level |
| Land Area | 47.9 Square Miles |
| Water Area | 2.3 Square Miles |


