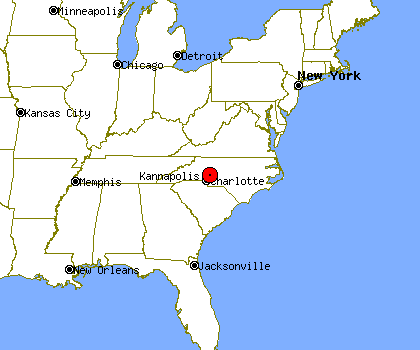
Kannapolis, NC Profile
Kannapolis, NC, population 43,404, is located
in North Carolina's Cabarrus county,
about 21.9 miles from Charlotte and 47.4 miles from Winston-Salem.
Through the 90's Kannapolis's population has grown by about 24%.
It is estimated that in the first 5 years of the past decade the population of Kannapolis has grown by about 6%. Since 2005 Kannapolis's population has grown by about 11%.
Kannapolis's property crime levels tend to be lower than
North Carolina's average level.
The same data shows violent crime levels in Kannapolis tend to be lower than North Carolina's average level.
Population Statistics
Gender
| Population by Gender |
|---|
| Males | 48% |
| Females | 52% |
Race
| Population by Race |
|---|
| White | 78% |
| African American | 16% |
| Native American | 0% |
| Asian | 1% |
| Hawaiian | 0% |
| Other/Mixed | 5% |
Age
| Median Age |
|---|
| Population | 9.99 |
| Males | 9.99 |
| Females | 9.99 |
| Males by Age | Females by Age |
|---|
| Under 20 | 9.99% | | Under 20: | 9.99% |
| 20 to 40 | 9.99% | | 20 to 40: | 9.99% |
| 40 to 60 | 9.99% | | 40 to 60: | 9.99% |
| Over 60 | 8.00% | | Over 60: | 9.99% |
Size
| Population by Year | Change Rate |
|---|
| 2000 | 37,231 | N/A |
| 2001 | 37,869 | 1.71% |
| 2002 | 38,173 | 0.80% |
| 2003 | 38,340 | 0.44% |
| 2004 | 38,546 | 0.54% |
| 2005 | 38,966 | 1.09% |
| 2006 | 40,129 | 2.98% |
| 2007 | 41,559 | 3.56% |
| 2008 | 42,720 | 2.79% |
| 2009 | 43,404 | 1.60% |
Economics
| Household Income |
|---|
| Median | $35,532 |
Law Enforcement Statistics
Violent Crime Reports
| Rate Per 100K People |
|---|
| 2001 | 296 |
| 2002 | 412 |
| 2003 | 307 |
| 2004 | 345 |
| 2005 | N/A |
| 2006 | 389 |
| 2007 | 434 |
| 2008 | 397 |
| 2009 | 313 |
| 2010 | 215 |
| Vs. State Violent Crime Rate |
|---|
| Year |
Murder, Man-Slaughter |
Forcible Rape |
Robbery |
Aggravated Assault |
| 2001 |
1 | 9 | 52 | 49 |
| 2002 |
2 | 15 | 52 | 88 |
| 2003 |
0 | 3 | 47 | 68 |
| 2004 |
2 | 8 | 48 | 76 |
| 2005 |
- | - | - | - |
| 2006 |
4 | 12 | 54 | 85 |
| 2007 |
1 | 13 | 57 | 105 |
| 2008 |
4 | 10 | 50 | 103 |
| 2009 |
5 | 12 | 48 | 70 |
| 2010 |
0 | 5 | 40 | 50 |
Property Crime Reports
| Rate Per 100K People |
|---|
| 2001 | 2,832 |
| 2002 | 2,566 |
| 2003 | 2,566 |
| 2004 | 2,127 |
| 2005 | N/A |
| 2006 | 2,604 |
| 2007 | 2,730 |
| 2008 | 2,774 |
| 2009 | 2,687 |
| 2010 | 2,164 |
| Vs. State Property Crime Rate |
|---|
| Year |
Burglary |
Larceny, Theft |
Motor Vehicle Theft |
| 2001 |
265 |
699 |
99 |
| 2002 |
212 |
704 |
63 |
| 2003 |
267 |
649 |
70 |
| 2004 |
210 |
550 |
65 |
| 2005 |
- |
- |
- |
| 2006 |
292 |
636 |
109 |
| 2007 |
366 |
604 |
137 |
| 2008 |
391 |
643 |
133 |
| 2009 |
360 |
709 |
91 |
| 2010 |
310 |
574 |
70 |
Location
| Elevation | 780 feet above sea level |
| Land Area | 15.7 Square Miles |
| Water Area | 0.2 Square Miles |


