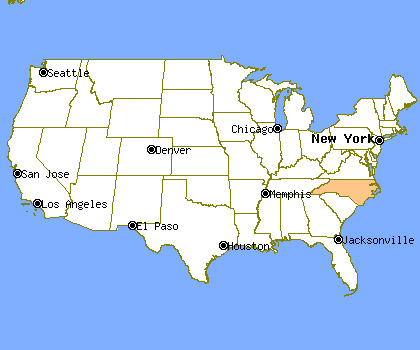
North Carolina Profile
Total Population: 9,380,884
Capital: Raleigh
Symbols
| State Flag |
|---|
 |
| State Seal |
|---|
 |
Population Statistics
Gender
| Population by Gender |
|---|
| Males | 49% |
| Females | 51% |
Race
| Population by Race |
|---|
| White | 72% |
| African American | 22% |
| Native American | 1% |
| Asian | 1% |
| Hawaiian | 0% |
| Other/Mixed | 4% |
Age
| Median Age |
|---|
| Population | 35.3 |
| Males | 33.8 |
| Females | 36.7 |
| Males by Age | Females by Age |
|---|
| Under 20 | 14% | | Under 20: | 13% |
| 20 to 40 | 15% | | 20 to 40: | 14% |
| 40 to 60 | 13% | | 40 to 60: | 13% |
| Over 60 | 7% | | Over 60: | 9% |
Size
| Population by Year | Annual Change |
|---|
| 2000 | 8,046,406 | N/A |
| 2001 | 8,203,451 | 1.95% |
| 2002 | 8,316,617 | 1.38% |
| 2003 | 8,416,451 | 1.20% |
| 2004 | 8,531,283 | 1.36% |
| 2005 | 8,669,452 | 1.62% |
| 2006 | 8,866,977 | 2.28% |
| 2007 | 9,064,074 | 2.22% |
| 2008 | 9,247,134 | 2.02% |
| 2009 | 9,380,884 | 1.45% |
Law Enforcement Statistics
Violent Crime Reports
| Rate Per 100K People |
|---|
| 2001 | 494 |
| 2002 | 470 |
| 2003 | 455 |
| 2004 | 448 |
| 2005 | 468 |
| 2006 | 476 |
| 2007 | 466 |
| 2008 | 467 |
| 2009 | 404 |
| 2010 | 363 |
| Vs. National Violent Crime Rate |
|---|
| Year |
Murder, Man-Slaughter |
Forcible Rape |
Robbery |
Aggravated Assault |
| 2001 |
505 | 2,083 | 13,304 | 24,573 |
| 2002 |
548 | 2,196 | 12,205 | 24,169 |
| 2003 |
509 | 2,139 | 12,229 | 23,369 |
| 2004 |
532 | 2,339 | 11,782 | 23,591 |
| 2005 |
585 | 2,302 | 12,635 | 25,128 |
| 2006 |
540 | 2,495 | 13,484 | 25,605 |
| 2007 |
585 | 2,385 | 13,548 | 25,744 |
| 2008 |
604 | 2,284 | 14,334 | 25,877 |
| 2009 |
494 | 2,306 | 11,825 | 23,304 |
| 2010 |
476 | 2,013 | 9,610 | 22,554 |
Property Crime Reports
| Rate Per 100K People |
|---|
| 2001 | 4,444 |
| 2002 | 4,251 |
| 2003 | 4,278 |
| 2004 | 4,160 |
| 2005 | 4,075 |
| 2006 | 4,121 |
| 2007 | 4,087 |
| 2008 | 4,044 |
| 2009 | 3,668 |
| 2010 | 3,447 |
| Vs. National Property Crime Rate |
|---|
| Year |
Burglary |
Larceny, Theft |
Motor Vehicle Theft |
| 2001 |
101,889 |
237,241 |
24,647 |
| 2002 |
99,535 |
229,307 |
24,866 |
| 2003 |
100,687 |
232,081 |
26,892 |
| 2004 |
101,193 |
227,147 |
26,988 |
| 2005 |
104,298 |
221,091 |
28,466 |
| 2006 |
107,407 |
227,427 |
30,126 |
| 2007 |
108,800 |
233,588 |
27,966 |
| 2008 |
111,602 |
234,616 |
26,743 |
| 2009 |
107,830 |
216,244 |
20,024 |
| 2010 |
102,690 |
207,719 |
18,310 |
Location
Cities & Towns
A
B
C
D
E
F
G
H
I
J
K
L
M
N
O
P
R
S
T
U
V
W
Y
Z

