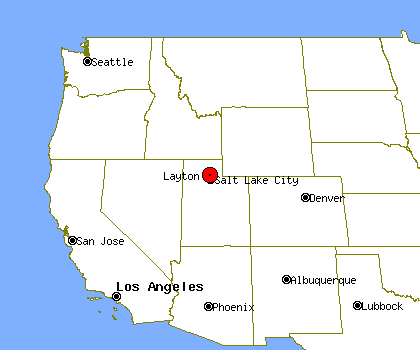
Layton, UT Profile
Layton, UT, population 66,747, is located
in Utah's Davis county,
about 21.1 miles from Salt Lake City and 25.5 miles from West Valley City.
Through the 90's Layton's population has grown by about 40%.
It is estimated that in the first 5 years of the past decade the population of Layton has grown by about 6%. Since 2005 Layton's population has grown by about 8%.
Layton's property crime levels tend to be about the same as
Utah's average level.
The same data shows violent crime levels in Layton tend to be lower than Utah's average level.
Population Statistics
Gender
| Population by Gender |
|---|
| Males | 50% |
| Females | 50% |
Race
| Population by Race |
|---|
| White | 90% |
| African American | 2% |
| Native American | 1% |
| Asian | 2% |
| Hawaiian | 0% |
| Other/Mixed | 5% |
Age
| Median Age |
|---|
| Population | 9.99 |
| Males | 9.99 |
| Females | 9.99 |
| Males by Age | Females by Age |
|---|
| Under 20 | 9.99% | | Under 20: | 9.99% |
| 20 to 40 | 9.99% | | 20 to 40: | 9.99% |
| 40 to 60 | 9.99% | | 40 to 60: | 9.99% |
| Over 60 | 4.00% | | Over 60: | 4.00% |
Size
| Population by Year | Change Rate |
|---|
| 2000 | 58,649 | N/A |
| 2001 | 59,606 | 1.63% |
| 2002 | 59,971 | 0.61% |
| 2003 | 60,671 | 1.17% |
| 2004 | 61,215 | 0.90% |
| 2005 | 61,753 | 0.88% |
| 2006 | 62,952 | 1.94% |
| 2007 | 64,413 | 2.32% |
| 2008 | 65,645 | 1.91% |
| 2009 | 66,747 | 1.68% |
Economics
| Household Income |
|---|
| Median | $52,128 |
Law Enforcement Statistics
Violent Crime Reports
| Rate Per 100K People |
|---|
| 2001 | 153 |
| 2002 | 195 |
| 2003 | 282 |
| 2004 | 181 |
| 2005 | 150 |
| 2006 | 157 |
| 2007 | 125 |
| 2008 | 154 |
| 2009 | 174 |
| 2010 | 157 |
| Vs. State Violent Crime Rate |
|---|
| Year |
Murder, Man-Slaughter |
Forcible Rape |
Robbery |
Aggravated Assault |
| 2001 |
2 | 22 | 19 | 48 |
| 2002 |
1 | 24 | 21 | 72 |
| 2003 |
2 | 35 | 26 | 109 |
| 2004 |
0 | 28 | 24 | 60 |
| 2005 |
2 | 32 | 17 | 44 |
| 2006 |
1 | 30 | 12 | 57 |
| 2007 |
1 | 21 | 14 | 43 |
| 2008 |
1 | 25 | 26 | 48 |
| 2009 |
0 | 21 | 23 | 71 |
| 2010 |
3 | 24 | 12 | 64 |
Property Crime Reports
| Rate Per 100K People |
|---|
| 2001 | 3,670 |
| 2002 | 4,036 |
| 2003 | 3,595 |
| 2004 | 2,933 |
| 2005 | 2,998 |
| 2006 | 3,061 |
| 2007 | 3,250 |
| 2008 | 3,303 |
| 2009 | 2,961 |
| 2010 | 3,531 |
| Vs. State Property Crime Rate |
|---|
| Year |
Burglary |
Larceny, Theft |
Motor Vehicle Theft |
| 2001 |
278 |
1,785 |
118 |
| 2002 |
387 |
1,930 |
131 |
| 2003 |
333 |
1,710 |
149 |
| 2004 |
283 |
1,426 |
102 |
| 2005 |
289 |
1,500 |
108 |
| 2006 |
271 |
1612 |
70 |
| 2007 |
288 |
1673 |
96 |
| 2008 |
380 |
1689 |
79 |
| 2009 |
240 |
1647 |
66 |
| 2010 |
398 |
1859 |
60 |
Location
| Elevation | 4,356 feet above sea level |
| Land Area | 18.3 Square Miles |
| Water Area | 0.1 Square Miles |


