Utah Profile
Total Population: 2,784,572
Capital: Salt Lake City
Symbols
| State Flag |
|---|
 |
| State Seal |
|---|
 |
Population Statistics
Gender
| Population by Gender |
|---|
| Males | 50% |
| Females | 50% |
Race
| Population by Race |
|---|
| White | 89% |
| African American | 1% |
| Native American | 1% |
| Asian | 2% |
| Hawaiian | 1% |
| Other/Mixed | 6% |
Age
| Median Age |
|---|
| Population | 27.1 |
| Males | 26.7 |
| Females | 27.7 |
| Males by Age | Females by Age |
|---|
| Under 20 | 19% | | Under 20: | 18% |
| 20 to 40 | 16% | | 20 to 40: | 14% |
| 40 to 60 | 10% | | 40 to 60: | 10% |
| Over 60 | 5% | | Over 60: | 6% |
Size
| Population by Year | Annual Change |
|---|
| 2000 | 2,233,204 | N/A |
| 2001 | 2,291,250 | 2.60% |
| 2002 | 2,334,473 | 1.89% |
| 2003 | 2,379,938 | 1.95% |
| 2004 | 2,438,915 | 2.48% |
| 2005 | 2,499,637 | 2.49% |
| 2006 | 2,583,724 | 3.36% |
| 2007 | 2,663,796 | 3.10% |
| 2008 | 2,727,343 | 2.39% |
| 2009 | 2,784,572 | 2.10% |
Law Enforcement Statistics
Violent Crime Reports
| Rate Per 100K People |
|---|
| 2001 | 234 |
| 2002 | 237 |
| 2003 | 249 |
| 2004 | 236 |
| 2005 | 227 |
| 2006 | 224 |
| 2007 | 235 |
| 2008 | 222 |
| 2009 | 213 |
| 2010 | 213 |
| Vs. National Violent Crime Rate |
|---|
| Year |
Murder, Man-Slaughter |
Forcible Rape |
Robbery |
Aggravated Assault |
| 2001 |
67 | 896 | 1,197 | 3,154 |
| 2002 |
47 | 943 | 1,140 | 3,358 |
| 2003 |
58 | 892 | 1,255 | 3,640 |
| 2004 |
46 | 933 | 1,236 | 3,424 |
| 2005 |
56 | 920 | 1,095 | 3,541 |
| 2006 |
46 | 869 | 1,245 | 3,562 |
| 2007 |
58 | 908 | 1,420 | 3,824 |
| 2008 |
39 | 893 | 1,421 | 3,717 |
| 2009 |
37 | 905 | 1,299 | 3,683 |
| 2010 |
53 | 948 | 1,268 | 3,610 |
Property Crime Reports
| Rate Per 100K People |
|---|
| 2001 | 4,009 |
| 2002 | 4,215 |
| 2003 | 4,226 |
| 2004 | 4,086 |
| 2005 | 3,869 |
| 2006 | 3,516 |
| 2007 | 3,500 |
| 2008 | 3,357 |
| 2009 | 3,275 |
| 2010 | 3,180 |
| Vs. National Property Crime Rate |
|---|
| Year |
Burglary |
Larceny, Theft |
Motor Vehicle Theft |
| 2001 |
13,804 |
70,676 |
6,513 |
| 2002 |
15,124 |
74,795 |
7,722 |
| 2003 |
16,769 |
74,829 |
7,764 |
| 2004 |
15,221 |
74,735 |
7,651 |
| 2005 |
14,971 |
72,082 |
8,493 |
| 2006 |
14,701 |
66,671 |
8,299 |
| 2007 |
15,541 |
68,241 |
8,812 |
| 2008 |
14,682 |
69,996 |
7,195 |
| 2009 |
15,159 |
69,142 |
6,904 |
| 2010 |
15,017 |
66,914 |
5,949 |
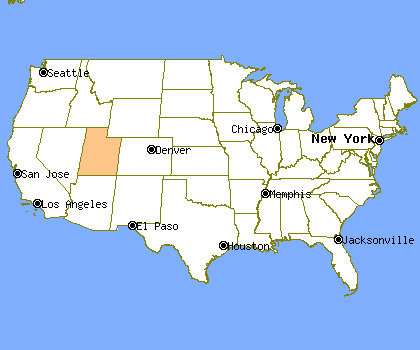
Location
Cities & Towns
A
B
C
D
E
F
G
H
I
J
K
L
M
N
O
P
R
S
T
U
V
W

