New Hampshire Profile
Total Population: 1,324,575
Capital: Concord
Symbols
| State Flag |
|---|
 |
| State Seal |
|---|
 |
Population Statistics
Gender
| Population by Gender |
|---|
| Males | 49% |
| Females | 51% |
Race
| Population by Race |
|---|
| White | 96% |
| African American | 1% |
| Native American | 0% |
| Asian | 1% |
| Hawaiian | 0% |
| Other/Mixed | 2% |
Age
| Median Age |
|---|
| Population | 37.1 |
| Males | 36.4 |
| Females | 37.8 |
| Males by Age | Females by Age |
|---|
| Under 20 | 14% | | Under 20: | 14% |
| 20 to 40 | 14% | | 20 to 40: | 13% |
| 40 to 60 | 14% | | 40 to 60: | 15% |
| Over 60 | 7% | | Over 60: | 9% |
Size
| Population by Year | Annual Change |
|---|
| 2000 | 1,235,791 | N/A |
| 2001 | 1,256,879 | 1.71% |
| 2002 | 1,271,163 | 1.14% |
| 2003 | 1,281,871 | 0.84% |
| 2004 | 1,292,766 | 0.85% |
| 2005 | 1,301,415 | 0.67% |
| 2006 | 1,311,894 | 0.81% |
| 2007 | 1,317,343 | 0.42% |
| 2008 | 1,321,872 | 0.34% |
| 2009 | 1,324,575 | 0.20% |
Law Enforcement Statistics
Violent Crime Reports
| Rate Per 100K People |
|---|
| 2001 | 170 |
| 2002 | 161 |
| 2003 | 149 |
| 2004 | 167 |
| 2005 | 132 |
| 2006 | 139 |
| 2007 | 137 |
| 2008 | 157 |
| 2009 | 160 |
| 2010 | 167 |
| Vs. National Violent Crime Rate |
|---|
| Year |
Murder, Man-Slaughter |
Forcible Rape |
Robbery |
Aggravated Assault |
| 2001 |
17 | 458 | 445 | 1,224 |
| 2002 |
12 | 446 | 413 | 1,185 |
| 2003 |
18 | 427 | 478 | 993 |
| 2004 |
18 | 459 | 500 | 1,193 |
| 2005 |
18 | 405 | 359 | 947 |
| 2006 |
13 | 344 | 423 | 1,044 |
| 2007 |
15 | 333 | 432 | 1,027 |
| 2008 |
13 | 391 | 419 | 1,246 |
| 2009 |
10 | 400 | 455 | 1,249 |
| 2010 |
13 | 412 | 451 | 1,322 |
Property Crime Reports
| Rate Per 100K People |
|---|
| 2001 | 2,151 |
| 2002 | 2,059 |
| 2003 | 2,054 |
| 2004 | 2,040 |
| 2005 | 1,796 |
| 2006 | 1,874 |
| 2007 | 1,892 |
| 2008 | 2,092 |
| 2009 | 2,161 |
| 2010 | 2,186 |
| Vs. National Property Crime Rate |
|---|
| Year |
Burglary |
Larceny, Theft |
Motor Vehicle Theft |
| 2001 |
4,889 |
20,060 |
2,140 |
| 2002 |
4,838 |
19,468 |
1,944 |
| 2003 |
4,552 |
19,979 |
1,917 |
| 2004 |
4,966 |
19,603 |
1,942 |
| 2005 |
4,153 |
18,042 |
1,337 |
| 2006 |
4,358 |
18,862 |
1,422 |
| 2007 |
4,986 |
18,611 |
1,299 |
| 2008 |
4,286 |
21,853 |
1,387 |
| 2009 |
4,928 |
22,572 |
1,124 |
| 2010 |
5,441 |
22,373 |
968 |
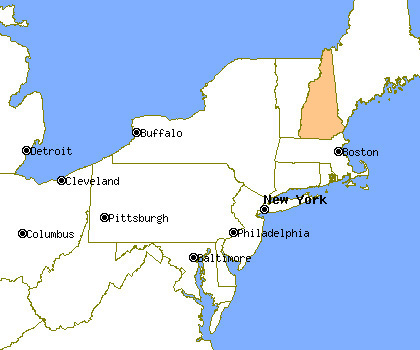
Location
Cities & Towns
A
B
C
D
E
F
G
H
J
K
L
M
N
P
R
S
T
W

