Illinois Profile
Total Population: 12,910,409
Capital: Springfield
Symbols
| State Flag |
|---|
 |
| State Seal |
|---|
 |
Population Statistics
Gender
| Population by Gender |
|---|
| Males | 49% |
| Females | 51% |
Race
| Population by Race |
|---|
| White | 73% |
| African American | 15% |
| Native American | 0% |
| Asian | 3% |
| Hawaiian | 0% |
| Other/Mixed | 9% |
Age
| Median Age |
|---|
| Population | 34.7 |
| Males | 33.3 |
| Females | 36 |
| Males by Age | Females by Age |
|---|
| Under 20 | 15% | | Under 20: | 14% |
| 20 to 40 | 15% | | 20 to 40: | 14% |
| 40 to 60 | 13% | | 40 to 60: | 13% |
| Over 60 | 7% | | Over 60: | 9% |
Size
| Population by Year | Annual Change |
|---|
| 2000 | 12,419,658 | N/A |
| 2001 | 12,507,833 | 0.71% |
| 2002 | 12,558,229 | 0.40% |
| 2003 | 12,597,981 | 0.32% |
| 2004 | 12,645,295 | 0.38% |
| 2005 | 12,674,452 | 0.23% |
| 2006 | 12,718,011 | 0.34% |
| 2007 | 12,779,417 | 0.48% |
| 2008 | 12,842,954 | 0.50% |
| 2009 | 12,910,409 | 0.53% |
Law Enforcement Statistics
Violent Crime Reports
| Rate Per 100K People |
|---|
| 2001 | 637 |
| 2002 | 621 |
| 2003 | 557 |
| 2004 | 543 |
| 2005 | 552 |
| 2006 | 542 |
| 2007 | 533 |
| 2008 | 525 |
| 2009 | 497 |
| 2010 | 435 |
| Vs. National Violent Crime Rate |
|---|
| Year |
Murder, Man-Slaughter |
Forcible Rape |
Robbery |
Aggravated Assault |
| 2001 |
986 | 3,938 | 24,867 | 49,713 |
| 2002 |
949 | 4,298 | 25,272 | 47,695 |
| 2003 |
896 | 4,167 | 23,809 | 41,584 |
| 2004 |
776 | 4,216 | 22,532 | 41,502 |
| 2005 |
766 | 4,297 | 23,187 | 42,142 |
| 2006 |
780 | 4,078 | 23,782 | 40,858 |
| 2007 |
752 | 4,103 | 23,100 | 40,573 |
| 2008 |
790 | 4,118 | 24,054 | 38,818 |
| 2009 |
773 | 3,901 | 22,923 | 36,588 |
| 2010 |
706 | 3,033 | 20,054 | 32,042 |
Property Crime Reports
| Rate Per 100K People |
|---|
| 2001 | 3,461 |
| 2002 | 3,396 |
| 2003 | 3,284 |
| 2004 | 3,186 |
| 2005 | 3,080 |
| 2006 | 3,020 |
| 2007 | 2,936 |
| 2008 | 2,933 |
| 2009 | 2,737 |
| 2010 | 2,681 |
| Vs. National Property Crime Rate |
|---|
| Year |
Burglary |
Larceny, Theft |
Motor Vehicle Theft |
| 2001 |
78,844 |
304,362 |
48,784 |
| 2002 |
81,123 |
301,892 |
44,857 |
| 2003 |
78,288 |
295,541 |
41,764 |
| 2004 |
75,944 |
288,771 |
40,355 |
| 2005 |
77,462 |
276,301 |
39,385 |
| 2006 |
77,259 |
272,578 |
37,641 |
| 2007 |
75,524 |
267,911 |
33,887 |
| 2008 |
78,968 |
266,815 |
32,572 |
| 2009 |
77,850 |
248,821 |
26,676 |
| 2010 |
75,399 |
239,794 |
28,796 |
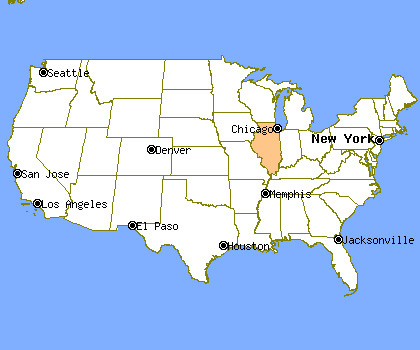
Location
Cities & Towns
A
B
C
D
E
F
G
H
I
J
K
L
M
N
O
P
Q
R
S
T
U
V
W
X
Y
Z

