Tennessee Profile
Total Population: 6,296,254
Capital: Nashville
Symbols
| State Flag |
|---|
 |
| State Seal |
|---|
 |
Population Statistics
Gender
| Population by Gender |
|---|
| Males | 49% |
| Females | 51% |
Race
| Population by Race |
|---|
| White | 80% |
| African American | 16% |
| Native American | 0% |
| Asian | 1% |
| Hawaiian | 0% |
| Other/Mixed | 3% |
Age
| Median Age |
|---|
| Population | 35.9 |
| Males | 34.5 |
| Females | 37.2 |
| Males by Age | Females by Age |
|---|
| Under 20 | 14% | | Under 20: | 13% |
| 20 to 40 | 15% | | 20 to 40: | 14% |
| 40 to 60 | 13% | | 40 to 60: | 14% |
| Over 60 | 7% | | Over 60: | 10% |
Size
| Population by Year | Annual Change |
|---|
| 2000 | 5,689,276 | N/A |
| 2001 | 5,755,443 | 1.16% |
| 2002 | 5,803,306 | 0.83% |
| 2003 | 5,856,522 | 0.92% |
| 2004 | 5,916,762 | 1.03% |
| 2005 | 5,995,748 | 1.33% |
| 2006 | 6,089,453 | 1.56% |
| 2007 | 6,172,862 | 1.37% |
| 2008 | 6,240,456 | 1.10% |
| 2009 | 6,296,254 | 0.89% |
Law Enforcement Statistics
Violent Crime Reports
| Rate Per 100K People |
|---|
| 2001 | 745 |
| 2002 | 717 |
| 2003 | 688 |
| 2004 | 695 |
| 2005 | 753 |
| 2006 | 760 |
| 2007 | 753 |
| 2008 | 722 |
| 2009 | 668 |
| 2010 | 613 |
| Vs. National Violent Crime Rate |
|---|
| Year |
Murder, Man-Slaughter |
Forcible Rape |
Robbery |
Aggravated Assault |
| 2001 |
425 | 2,196 | 10,219 | 29,938 |
| 2002 |
420 | 2,290 | 9,413 | 29,439 |
| 2003 |
395 | 2,085 | 9,372 | 28,325 |
| 2004 |
351 | 2,220 | 8,840 | 29,613 |
| 2005 |
432 | 2,171 | 9,974 | 32,314 |
| 2006 |
409 | 2,142 | 11,129 | 32,227 |
| 2007 |
397 | 2,174 | 11,022 | 32,787 |
| 2008 |
408 | 2,062 | 10,800 | 31,627 |
| 2009 |
461 | 1,993 | 9,647 | 29,940 |
| 2010 |
357 | 2,138 | 8,366 | 28,060 |
Property Crime Reports
| Rate Per 100K People |
|---|
| 2001 | 4,408 |
| 2002 | 4,302 |
| 2003 | 4,379 |
| 2004 | 4,306 |
| 2005 | 4,276 |
| 2006 | 4,128 |
| 2007 | 4,089 |
| 2008 | 4,043 |
| 2009 | 3,754 |
| 2010 | 3,658 |
| Vs. National Property Crime Rate |
|---|
| Year |
Burglary |
Larceny, Theft |
Motor Vehicle Theft |
| 2001 |
59,705 |
165,015 |
28,272 |
| 2002 |
61,248 |
161,610 |
26,541 |
| 2003 |
63,207 |
166,216 |
26,410 |
| 2004 |
60,205 |
169,169 |
24,749 |
| 2005 |
61,233 |
168,637 |
25,078 |
| 2006 |
62,859 |
163,845 |
22,593 |
| 2007 |
61,715 |
168,351 |
21,658 |
| 2008 |
65,006 |
167,015 |
19,224 |
| 2009 |
63,646 |
157,746 |
14,973 |
| 2010 |
64,235 |
153,062 |
14,835 |
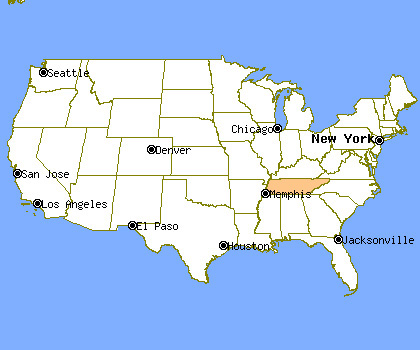
Location
Cities & Towns
A
B
C
D
E
F
G
H
I
J
K
L
M
N
O
P
R
S
T
U
V
W
Y

