Massachusetts Profile
Total Population: 6,593,587
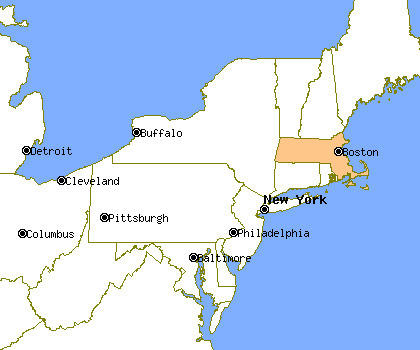
Capital: Boston
Symbols
| State Flag |
|---|
 |
| State Seal |
|---|
 |
Population Statistics
Gender
| Population by Gender |
|---|
| Males | 48% |
| Females | 52% |
Race
| Population by Race |
|---|
| White | 85% |
| African American | 5% |
| Native American | 0% |
| Asian | 4% |
| Hawaiian | 0% |
| Other/Mixed | 6% |
Age
| Median Age |
|---|
| Population | 36.5 |
| Males | 35.4 |
| Females | 37.7 |
| Males by Age | Females by Age |
|---|
| Under 20 | 13% | | Under 20: | 13% |
| 20 to 40 | 15% | | 20 to 40: | 14% |
| 40 to 60 | 13% | | 40 to 60: | 14% |
| Over 60 | 7% | | Over 60: | 10% |
Size
| Population by Year | Annual Change |
|---|
| 2000 | 6,349,119 | N/A |
| 2001 | 6,411,730 | 0.99% |
| 2002 | 6,440,978 | 0.46% |
| 2003 | 6,451,637 | 0.17% |
| 2004 | 6,451,279 | -0.01% |
| 2005 | 6,453,031 | 0.03% |
| 2006 | 6,466,399 | 0.21% |
| 2007 | 6,499,275 | 0.51% |
| 2008 | 6,543,595 | 0.68% |
| 2009 | 6,593,587 | 0.76% |
Law Enforcement Statistics
Violent Crime Reports
| Rate Per 100K People |
|---|
| 2001 | 479 |
| 2002 | 484 |
| 2003 | 469 |
| 2004 | 459 |
| 2005 | 457 |
| 2006 | 447 |
| 2007 | 432 |
| 2008 | 449 |
| 2009 | 457 |
| 2010 | 467 |
| Vs. National Violent Crime Rate |
|---|
| Year |
Murder, Man-Slaughter |
Forcible Rape |
Robbery |
Aggravated Assault |
| 2001 |
145 | 1,856 | 6,476 | 22,110 |
| 2002 |
173 | 1,777 | 7,169 | 22,018 |
| 2003 |
142 | 1,798 | 7,985 | 20,271 |
| 2004 |
169 | 1,799 | 7,467 | 20,002 |
| 2005 |
175 | 1,732 | 7,615 | 19,715 |
| 2006 |
186 | 1,742 | 8,047 | 18,800 |
| 2007 |
184 | 1,634 | 7,006 | 19,008 |
| 2008 |
167 | 1,736 | 7,069 | 20,202 |
| 2009 |
172 | 1,701 | 7,427 | 20,836 |
| 2010 |
210 | 1,745 | 6,874 | 21,724 |
Property Crime Reports
| Rate Per 100K People |
|---|
| 2001 | 2,619 |
| 2002 | 2,610 |
| 2003 | 2,549 |
| 2004 | 2,460 |
| 2005 | 2,364 |
| 2006 | 2,391 |
| 2007 | 2,392 |
| 2008 | 2,400 |
| 2009 | 2,304 |
| 2010 | 2,351 |
| Vs. National Property Crime Rate |
|---|
| Year |
Burglary |
Larceny, Theft |
Motor Vehicle Theft |
| 2001 |
32,430 |
106,821 |
27,828 |
| 2002 |
33,243 |
107,922 |
26,588 |
| 2003 |
34,722 |
103,790 |
25,506 |
| 2004 |
34,469 |
101,303 |
22,053 |
| 2005 |
34,624 |
97,737 |
18,880 |
| 2006 |
35,181 |
100,771 |
17,961 |
| 2007 |
35,662 |
103,592 |
14,992 |
| 2008 |
36,094 |
107,128 |
12,737 |
| 2009 |
34,665 |
105,514 |
11,735 |
| 2010 |
37,767 |
104,685 |
11,453 |
Location
Cities & Towns
A
B
C
D
E
F
G
H
I
K
L
M
N
O
P
Q
R
S
T
U
V
W
Y

