Georgia Profile
Total Population: 9,829,211
Capital: Atlanta
Symbols
| State Flag |
|---|
 |
| State Seal |
|---|
 |
Population Statistics
Gender
| Population by Gender |
|---|
| Males | 49% |
| Females | 51% |
Race
| Population by Race |
|---|
| White | 65% |
| African American | 29% |
| Native American | 0% |
| Asian | 2% |
| Hawaiian | 0% |
| Other/Mixed | 4% |
Age
| Median Age |
|---|
| Population | 33.4 |
| Males | 32.1 |
| Females | 34.6 |
| Males by Age | Females by Age |
|---|
| Under 20 | 15% | | Under 20: | 14% |
| 20 to 40 | 16% | | 20 to 40: | 15% |
| 40 to 60 | 13% | | 40 to 60: | 13% |
| Over 60 | 5% | | Over 60: | 8% |
Size
| Population by Year | Annual Change |
|---|
| 2000 | 8,186,781 | N/A |
| 2001 | 8,419,594 | 2.84% |
| 2002 | 8,585,535 | 1.97% |
| 2003 | 8,735,259 | 1.74% |
| 2004 | 8,913,676 | 2.04% |
| 2005 | 9,097,428 | 2.06% |
| 2006 | 9,330,086 | 2.56% |
| 2007 | 9,533,761 | 2.18% |
| 2008 | 9,697,838 | 1.72% |
| 2009 | 9,829,211 | 1.35% |
Law Enforcement Statistics
Violent Crime Reports
| Rate Per 100K People |
|---|
| 2001 | 497 |
| 2002 | 459 |
| 2003 | 454 |
| 2004 | 455 |
| 2005 | 449 |
| 2006 | 471 |
| 2007 | 493 |
| 2008 | 479 |
| 2009 | 426 |
| 2010 | 403 |
| Vs. National Violent Crime Rate |
|---|
| Year |
Murder, Man-Slaughter |
Forcible Rape |
Robbery |
Aggravated Assault |
| 2001 |
598 | 2,180 | 14,402 | 24,491 |
| 2002 |
606 | 2,108 | 13,432 | 23,125 |
| 2003 |
656 | 2,233 | 14,055 | 22,478 |
| 2004 |
613 | 2,387 | 13,656 | 23,561 |
| 2005 |
564 | 2,143 | 14,041 | 23,977 |
| 2006 |
600 | 2,173 | 15,509 | 25,824 |
| 2007 |
718 | 2,178 | 17,340 | 26,839 |
| 2008 |
636 | 2,195 | 17,357 | 26,196 |
| 2009 |
566 | 2,301 | 14,603 | 24,410 |
| 2010 |
558 | 2,093 | 12,373 | 24,048 |
Property Crime Reports
| Rate Per 100K People |
|---|
| 2001 | 4,149 |
| 2002 | 4,048 |
| 2003 | 4,255 |
| 2004 | 4,266 |
| 2005 | 4,172 |
| 2006 | 3,889 |
| 2007 | 3,901 |
| 2008 | 4,016 |
| 2009 | 3,667 |
| 2010 | 3,640 |
| Vs. National Property Crime Rate |
|---|
| Year |
Burglary |
Larceny, Theft |
Motor Vehicle Theft |
| 2001 |
71,799 |
238,484 |
37,589 |
| 2002 |
73,932 |
234,591 |
38,036 |
| 2003 |
78,961 |
247,169 |
43,371 |
| 2004 |
82,992 |
249,426 |
44,238 |
| 2005 |
84,463 |
249,594 |
44,477 |
| 2006 |
85,117 |
235,903 |
43,163 |
| 2007 |
90,690 |
239,058 |
42,594 |
| 2008 |
100,629 |
248,678 |
39,628 |
| 2009 |
98,362 |
228,893 |
33,145 |
| 2010 |
96,723 |
225,651 |
30,305 |
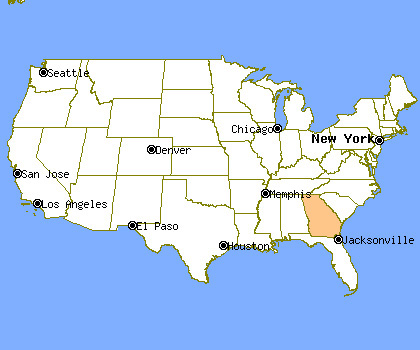
Location
Cities & Towns
A
B
C
D
E
F
G
H
I
J
K
L
M
N
O
P
Q
R
S
T
U
V
W
Y
Z

