Iowa Profile
Total Population: 3,007,856
Capital: Des Moines
Symbols
| State Flag |
|---|
 |
| State Seal |
|---|
 |
Population Statistics
Gender
| Population by Gender |
|---|
| Males | 49% |
| Females | 51% |
Race
| Population by Race |
|---|
| White | 94% |
| African American | 2% |
| Native American | 0% |
| Asian | 1% |
| Hawaiian | 0% |
| Other/Mixed | 3% |
Age
| Median Age |
|---|
| Population | 36.6 |
| Males | 35.2 |
| Females | 38 |
| Males by Age | Females by Age |
|---|
| Under 20 | 15% | | Under 20: | 14% |
| 20 to 40 | 14% | | 20 to 40: | 12% |
| 40 to 60 | 13% | | 40 to 60: | 13% |
| Over 60 | 8% | | Over 60: | 11% |
Size
| Population by Year | Annual Change |
|---|
| 2000 | 2,926,380 | N/A |
| 2001 | 2,929,424 | 0.10% |
| 2002 | 2,929,264 | -0.01% |
| 2003 | 2,932,799 | 0.12% |
| 2004 | 2,941,358 | 0.29% |
| 2005 | 2,949,450 | 0.28% |
| 2006 | 2,964,391 | 0.51% |
| 2007 | 2,978,719 | 0.48% |
| 2008 | 2,993,987 | 0.51% |
| 2009 | 3,007,856 | 0.46% |
Law Enforcement Statistics
Violent Crime Reports
| Rate Per 100K People |
|---|
| 2001 | 269 |
| 2002 | 286 |
| 2003 | 272 |
| 2004 | 271 |
| 2005 | 291 |
| 2006 | 284 |
| 2007 | 295 |
| 2008 | 284 |
| 2009 | 400 |
| 2010 | 274 |
| Vs. National Violent Crime Rate |
|---|
| Year |
Murder, Man-Slaughter |
Forcible Rape |
Robbery |
Aggravated Assault |
| 2001 |
50 | 649 | 1,154 | 6,012 |
| 2002 |
44 | 797 | 1,169 | 6,378 |
| 2003 |
47 | 762 | 1,123 | 6,088 |
| 2004 |
46 | 790 | 1,124 | 6,043 |
| 2005 |
38 | 827 | 1,154 | 6,623 |
| 2006 |
55 | 828 | 1,298 | 6,274 |
| 2007 |
37 | 904 | 1,313 | 6,551 |
| 2008 |
76 | 888 | 1,248 | 6,308 |
| 2009 |
119 | 1,096 | 1,786 | 8,277 |
| 2010 |
39 | 836 | 1,011 | 6,447 |
Property Crime Reports
| Rate Per 100K People |
|---|
| 2001 | 3,032 |
| 2002 | 3,163 |
| 2003 | 2,961 |
| 2004 | 2,905 |
| 2005 | 2,834 |
| 2006 | 2,803 |
| 2007 | 2,616 |
| 2008 | 2,421 |
| 2009 | 3,208 |
| 2010 | 2,243 |
| Vs. National Property Crime Rate |
|---|
| Year |
Burglary |
Larceny, Theft |
Motor Vehicle Theft |
| 2001 |
16,885 |
66,244 |
5,505 |
| 2002 |
18,643 |
68,411 |
5,823 |
| 2003 |
17,546 |
64,031 |
5,601 |
| 2004 |
18,174 |
62,258 |
5,404 |
| 2005 |
17,987 |
60,594 |
5,475 |
| 2006 |
18,017 |
60,556 |
5,006 |
| 2007 |
16,941 |
56,328 |
4,885 |
| 2008 |
16,450 |
51,907 |
4,332 |
| 2009 |
19,469 |
64,997 |
5,954 |
| 2010 |
16,656 |
47,883 |
3,776 |
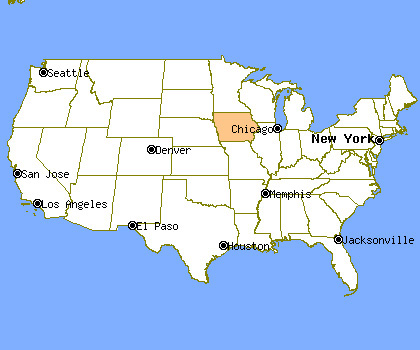
Location
Cities & Towns
A
B
C
D
E
F
G
H
I
J
K
L
M
N
O
P
Q
R
S
T
U
V
W
Y
Z

