North Dakota Profile
Total Population: 646,844
Capital: Bismarck
Symbols
| State Flag |
|---|
 |
| State Seal |
|---|
 |
Population Statistics
Gender
| Population by Gender |
|---|
| Males | 50% |
| Females | 50% |
Race
| Population by Race |
|---|
| White | 92% |
| African American | 1% |
| Native American | 5% |
| Asian | 1% |
| Hawaiian | 0% |
| Other/Mixed | 1% |
Age
| Median Age |
|---|
| Population | 36.2 |
| Males | 34.8 |
| Females | 37.5 |
| Males by Age | Females by Age |
|---|
| Under 20 | 15% | | Under 20: | 14% |
| 20 to 40 | 14% | | 20 to 40: | 12% |
| 40 to 60 | 13% | | 40 to 60: | 13% |
| Over 60 | 8% | | Over 60: | 10% |
Size
| Population by Year | Annual Change |
|---|
| 2000 | 642,195 | N/A |
| 2001 | 636,267 | -0.92% |
| 2002 | 633,617 | -0.42% |
| 2003 | 632,809 | -0.13% |
| 2004 | 636,303 | 0.55% |
| 2005 | 635,365 | -0.15% |
| 2006 | 636,771 | 0.22% |
| 2007 | 638,202 | 0.22% |
| 2008 | 641,421 | 0.50% |
| 2009 | 646,844 | 0.85% |
Law Enforcement Statistics
Violent Crime Reports
| Rate Per 100K People |
|---|
| 2001 | 80 |
| 2002 | 78 |
| 2003 | 78 |
| 2004 | 79 |
| 2005 | 98 |
| 2006 | 128 |
| 2007 | 142 |
| 2008 | 166 |
| 2009 | 201 |
| 2010 | 225 |
| Vs. National Violent Crime Rate |
|---|
| Year |
Murder, Man-Slaughter |
Forcible Rape |
Robbery |
Aggravated Assault |
| 2001 |
7 | 164 | 60 | 274 |
| 2002 |
5 | 163 | 58 | 270 |
| 2003 |
12 | 151 | 51 | 279 |
| 2004 |
9 | 159 | 39 | 297 |
| 2005 |
7 | 154 | 47 | 417 |
| 2006 |
8 | 193 | 72 | 540 |
| 2007 |
12 | 207 | 70 | 622 |
| 2008 |
3 | 232 | 72 | 761 |
| 2009 |
10 | 225 | 105 | 958 |
| 2010 |
10 | 237 | 90 | 1,176 |
Property Crime Reports
| Rate Per 100K People |
|---|
| 2001 | 2,338 |
| 2002 | 2,328 |
| 2003 | 2,096 |
| 2004 | 1,917 |
| 2005 | 1,978 |
| 2006 | 2,000 |
| 2007 | 1,890 |
| 2008 | 1,894 |
| 2009 | 1,933 |
| 2010 | 1,769 |
| Vs. National Property Crime Rate |
|---|
| Year |
Burglary |
Larceny, Theft |
Motor Vehicle Theft |
| 2001 |
2,165 |
11,583 |
1,086 |
| 2002 |
2,243 |
11,501 |
1,018 |
| 2003 |
1,941 |
10,267 |
1,078 |
| 2004 |
1,910 |
9,342 |
906 |
| 2005 |
1,986 |
9,552 |
1,057 |
| 2006 |
2,393 |
9,314 |
1,012 |
| 2007 |
2,164 |
9,010 |
914 |
| 2008 |
2,106 |
9,164 |
882 |
| 2009 |
2,354 |
9,296 |
852 |
| 2010 |
1,966 |
9,070 |
859 |
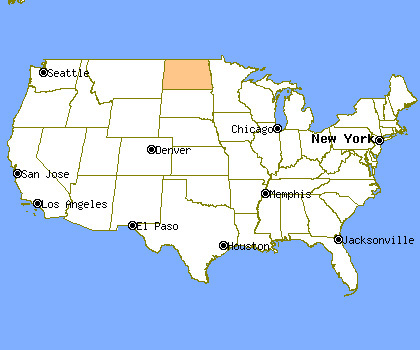
Location
Cities & Towns
A
B
C
D
E
F
G
H
I
J
K
L
M
N
O
P
R
S
T
U
V
W
Y
Z

